Retriever Gives You the Information You Need When You Need It!
Local and wide-area diagrams give instant access to desired information.
Animated line flows and interface flows coupled with dynamic pie charts bring system diagrams to life.
-
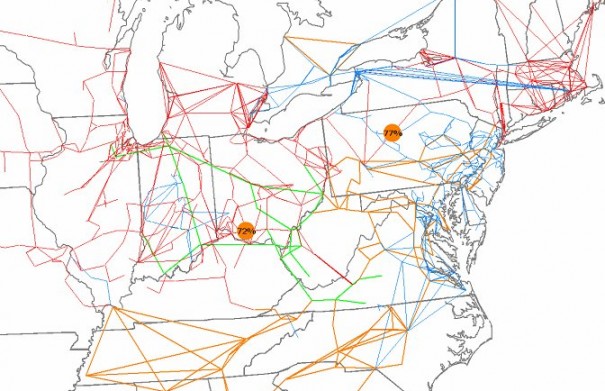
- The size of the pie-charts on this diagram varies with percent line flow for the measured line. Additionally, the pie-charts do not appear until a user-specified warning level is reached
-
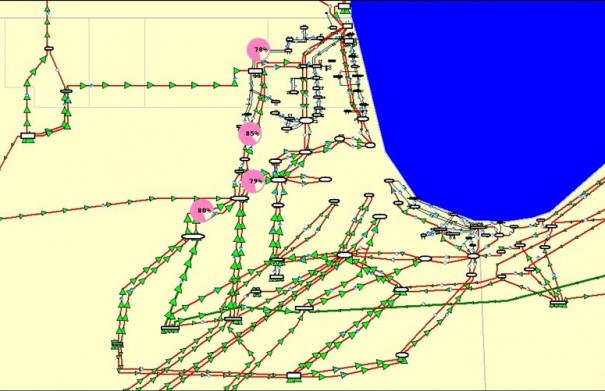
- Line Flows can be displayed and animated. This diagram uses moving arrows whose size, speed, and direction are proportional to the measured flow.
-
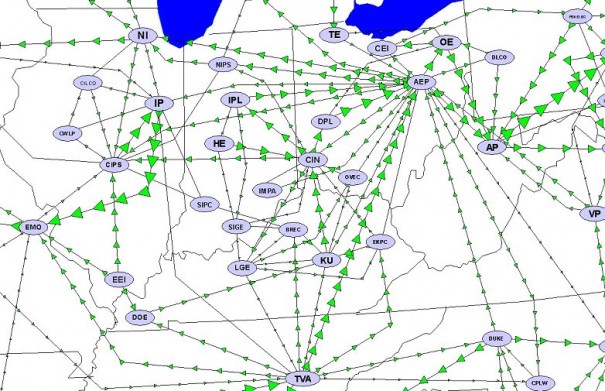
- Area, Zone, Group Diagrams: This area diagram represents control areas as bubbles and animates interface flows. Interfaces can be automatically defined as the collection of tie-lines between areas, zones, or injection groups.