Transient stability voltage collapse: See it with large plots and Min/Max result tracking
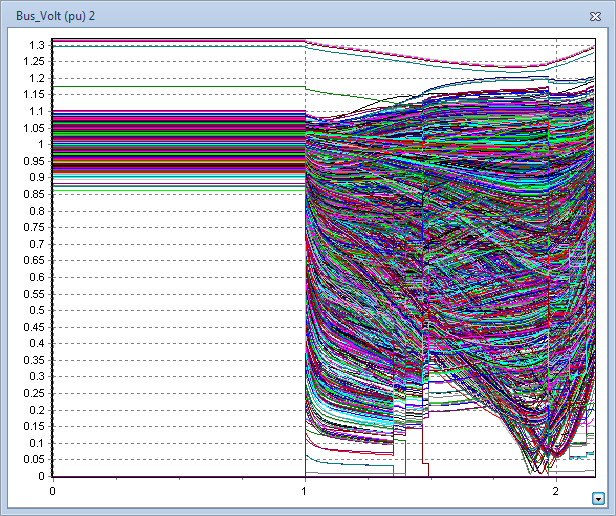
We had a rather strange support question from a customer running a transient stability run with a three-phase fault that was on for 2 seconds on a 230 kV bus (they were studying delayed clearing of a fault with about a dozen switching actions occurring which eventually cleared the fault after 2 seconds). The network boundary solution was failing after about 1.2 seconds. The user shared the case with us and we were indeed replicating the solution failure. The system dynamics were not going unstable in this situation at all, so we began to suspect there was a voltage collapse occurring. In talking with the user via phone however, they had already made use of the feature to plot every voltage to look for collapsing voltages and said the voltages were recovering. We took their case and did a plot of all the bus voltages and confirmed this. This is shown in the next figure which shows the voltage until the network boundary condition solution failed. You can indeed see in this picture that all the voltages are “going up” at the end which doesn’t seem to indicate voltage collapse.
We talked on the phone a bit more with the user and they said they were looking at the voltage in the “nearby states”. We looked at their Save to Hard Drive Options and saw that they were using the “Only store every result for objects which meet the Area/Zone Filters”. This is shown in the following figure.

That peaked interest, so we went in and modified it to store results for the entire system and reran the simulation. Then we redid the plot of every bus voltage and found the following. Notice that in this plot you can see that there are some “downward slanted” lines at the end of this plot, so something is seeing a voltage collapse. You can see this even though there are 20,000 lines on this plot!

We then modified the “min/max” options to only start keeping track of min/max values after 2.10 seconds. See the next picture.

Then we took those results for min/max values and stuck them in a spreadsheet. We deleted all results that had MinVolt values less than 0.1 per unit (those are all right around the fault anyway, so we’re not interested in those). We then sorted what remained from highest “Time Min Volt” to lowest. That way we can see the bus voltages that had a minimum value at the very last recorded time step which would indicate they were decreasing. We then saw that all these minimum voltages were in one control area. We then went back and did a plot of voltages for all buses in that control area and it looked as follows:

Clearly there was a voltage collapse in that control area and the result Simulator was reporting was correct. This is a good example making good use of plots with 20,000 values on them to help see what’s going on in your case! It’s also an example of how voltage collapse may not occur right next to your fault but somewhere hundreds of miles away!
Tags: FAQ,Simulator,Tip,Transient Stability
April 3, 2015