Calculating the Net Reactive Capability Curve of a Renewable Energy Plant and Subsystem
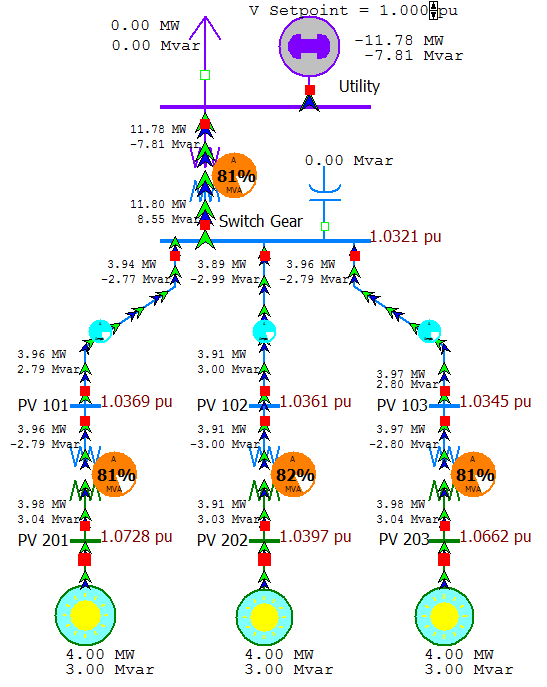
When studying a system of small renewable generators that are all hooked up to the power system through one interconnection point, some PowerWorld users have been interested in calculating the net reactive capability curve seen at the utility interconnection point. As an example consider the power system below which has the following characteristics.
- Three solar generators at the bottom representing our renewable generators
- Various transmission lines and transformers represent the connection point to the rest of the system
- Generator at the top bus named “Utility” representing the interconnection point to the rest of the system.
The generator at the top is modeled as the slack bus, and you may be interested in what the net injection the utility will see as the solar generators operating on the edge of their own capability curves. Another knowledge base article was written to address this situation and is found at the following link:
Tags: How-to,Product,Simulator,Tip,Tutorial
June 6, 2013

