Comparing Contingency Results
The Knowledge Base Article will cover how to take several contingency analysis runs done on the same system topology under different conditions and then build an Microsoft Access database that uses a query to compare the results across different contingency runs.
Creating a Test Example of Three Different Contingency Analysis Runs on the same case
The files used in this example are
- MultCTG_B7FLAT.pwb
- MultCTG_B7FLAT.pwd
- MultCTG_ContingencyList.aux
- MultCTG_ScriptToCreateResults.aux
- Outage Table.csv
- Multi Contingency Comparison.accdb
The starting case used for this example is the b7flat.pwb case that comes pre-installed with all Simulator installation. You download these directly from the links MultCTG_B7FLAT.pwb and MultCTG_B7FLAT.pwd. Using this as a starting point all double line outages are auto-inserted into the case (55 contingencies). In addition the columns for the contingency violation results are customized to show a set fields appropriate for this example. You may add your own fields if you find you need them. In addition, the limit monitoring settings are modified so that any lines loaded at 50% and higher are flagged as branch flow violations. This is done simply create a lot of results to compare together even for this small case.
To speed this example, we have defined all this information in the following Auxiliary File (MultCTG_ContingencyList.aux). Simply load this AUX file into your case by choose File, Load Auxiliary File from the main ribbon inside PowerWorld Simulator. At this point we want to create a set of different contingency results under different system conditions and save them out to a CSV file so that we can then write a query against this final set of results to do the comparison. The CSV file we want to create in this example has the following headings:
Scenario,Label,CTG: Owner Name,CTG: Owner Number,Cust String 3,Number From,Number To,Name From,Name To,Nom kV From,Nom kV To,Circuit,Viol: Owner Names,Viol: Owner Numbers,Category,Limit,Percent,Reference Value,Value,Change Percent
See the first row of the Outage Table.csv for a direct example.
The key to this example is that the FIRST column “Scenario” represents a particular system condition on which the contingency analysis results are run. This isn’t really a field of Simulator, but just something you the user must manage. The remaining columns are all columns that you can get by picking fields on the Contingency Analysis Dialog under Results, Contingency Violation List. This is depicted in the following image

One could customize the fields, but this example uses a subset of the fields on this table. In order to generate some sample data, the b7flat.pwb case is used with the following script to generate a set of results using the contingency list loaded before. You can download the AUX file described below at the link MultCTG_ScriptToCreateResults.aux as well. Make special note in this script of the user of the command
SaveDataWithExtra ()
This command allow the script to include an extra column with each row exported to the CSV file. This column is used the denote the particular Scenario of interest. This script command was added specifically for situations like this were it was of interest to denote something for a set of results. In this case after the 3 different contingency scenarios run, we include a denotation with each contingency-violation indicating which particular scenario this vontingency-violation belongs to.
SCRIPT
{
 EnterMode(Run);
// Flag all buses as active in Scaling command to be run shortly
 SetData(Bus, [BusScale], ["Yes"], All);
// clear out any existing file and write header for CSV file
DeleteFile("c:\MultCTG\SampleOutput.csv");
WriteTextToFile("c:\MultCTG\SampleOutput.csv", "Scenario,Label,CTG: Owner Name,CTG: Owner Number,Cust String 3,Number From,Number To,Name From,Name To,Nom kV From,Nom kV To,Circuit,Viol: Owner Names,Viol: Owner Numbers,Category,Limit,Percent,Reference Value,Value,Change Percent");
//----------------------------------------------------------------
 // Process and store results for "Low Load" Scenario
 //----------------------------------------------------------------
 Scale(Load, Factor, [0.80], Bus); // Scale the system load down to 80%
 SolvePowerFlow; // Solve the power flow
 CTGSetAsReference; // Set as contingency reference
 CTGSolveAll; // Solve all contingencies
 // Append results to a CSV file tacking the "Low Load" string on the front of each result
 SaveDataWithExtra("c:\MultCTG\SampleOutput.csv", CSVNOHEADER, ViolationCTG,
                   [CTGLabel,OwnerName,OwnerName:1,CustomString:2,BusNum,BusNum:1,BusName,BusName:1,
                    BusNomVolt:1,BusNomVolt:2,LineCircuit,OwnerName:2,OwnerName:3,
                    LimViolCat,LimViolLimit,LimViolPct,LimViolValue:2,LimViolValue,LimViolPct:1],
                   [], "", [],
                   ["Scenario"], ["Low Load"]
                   );
//----------------------------------------------------------------
 // Process and store results for "Base Load" Scenario
 //----------------------------------------------------------------
 Scale(Load, Factor, [1.25], Bus); // Scale the system load back up to original value (0.8 * 1.25 = 1.0)
 SolvePowerFlow; // Solve the power flow
 CTGSetAsReference; // Set as contingency reference
 CTGSolveAll; // Solve all contingencies
 // Append results to a CSV file tacking the "Base Load" string on the front of each result
 SaveDataWithExtra("c:\MultCTG\SampleOutput.csv", CSVNOHEADER, ViolationCTG,
                   [CTGLabel,OwnerName,OwnerName:1,CustomString:2,BusNum,BusNum:1,BusName,BusName:1,
                    BusNomVolt:1,BusNomVolt:2,LineCircuit,OwnerName:2,OwnerName:3,
                    LimViolCat,LimViolLimit,LimViolPct,LimViolValue:2,LimViolValue,LimViolPct:1],
                   [], "", [],
                   ["Scenario"], ["Base Load"]
                   );
//----------------------------------------------------------------
 // Process and store results for "High Load" Scenario
 //----------------------------------------------------------------
 Scale(Load, Factor, [1.20], Bus); // Scale the system load up to 20% higher than base
 SolvePowerFlow; // Solve the power flow
 CTGSetAsReference; // Set as contingency reference
 CTGSolveAll; // Solve all contingencies
 // Append results to a CSV file tacking the "High Load" string on the front of each result
 SaveDataWithExtra("c:\MultCTG\SampleOutput.csv", CSVNOHEADER, ViolationCTG,
                   [CTGLabel,OwnerName,OwnerName:1,CustomString:2,BusNum,BusNum:1,BusName,BusName:1,
                    BusNomVolt:1,BusNomVolt:2,LineCircuit,OwnerName:2,OwnerName:3,
                    LimViolCat,LimViolLimit,LimViolPct,LimViolValue:2,LimViolValue,LimViolPct:1],
                   [], "", [],
                   ["Scenario"], ["High Load"]
                   );
}
|
To recap, the steps needed to create the sample files are as follows
- Download the case MultCTG_B7FLAT.pwb, MultCTG_B7FLAT.pwd
- Open the case and load the auxiliary file MultCTG_ContingencyList.aux to define contingencies and setup monitoring
- Then open the auxiliary file MultCTG_ScriptToCreateResults.aux which runs the scrip above
- This will create a file in c:\MultCTG\ called Outage Table.csv.
You can also just download this file here (Outage Table.csv) without going through this process and continue with the remainder of this knowledge base article on using Access.
Comparing Contingency Results Stored in a CSV file
Now that you have a CSV file containing the results of all your various contingency scenarios in one table, you can use Microsoft Access (or for that matter any relational database that support SQL queries). This example will walk you through how to do that in Microsoft Access only.
- The first step will be to open Microsoft Access. Then choose File and open a Blank Database.
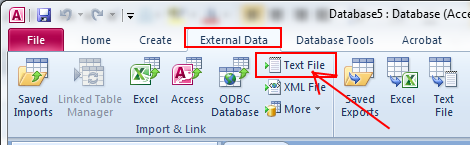
- Next choose External Data, and then choose Text File from the Import & Link group
- In the dialog that appears click Browse to point at the file Outage Table.csv you have created. Choose this file and click Open.
- Choose the option Link to data source by creating a linked table (this will allow you to simple replace that CSV file in the future and then reopen the same Access Database to redo your comparison)
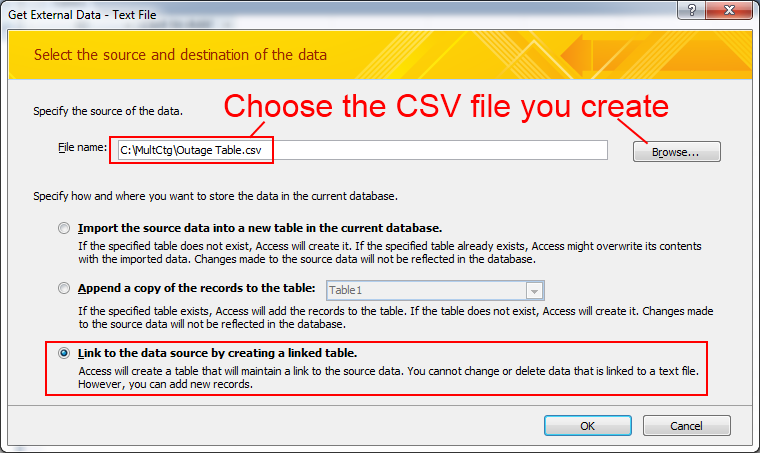
- Click OK
- On the next dialog keep the Delimited choice as you have a comma-separated values file.
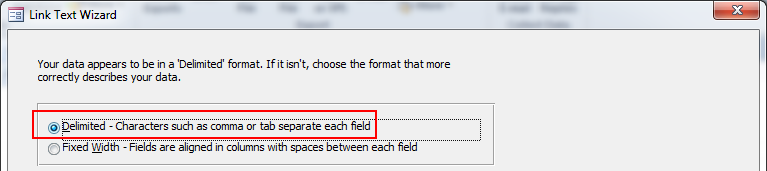
- Click Next >
- Choose Comma as the delimiter. Check the box First Row Contains Field Names
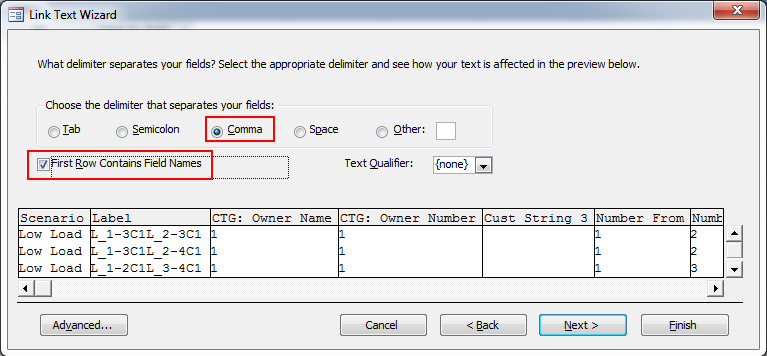
- Click Finish.
Now that you have access opened and linked to your table, you need to create a Query. This query will make use of a couple special features of Microsoft Access (really any SQL tool)
- Build what is called a “Crosstab Query”
- Build an Expression Builder
The steps for building the Crosstab Query are as follows
- Choose Create from the Ribbon and then Query Design.
- On the Show Table dialog that appears click on Tables, and then Outage Table and choose Add (this assigns your table to be used by this Query)
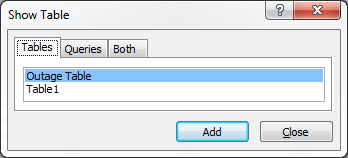
- Click Close to dismiss the Show Table dialog.
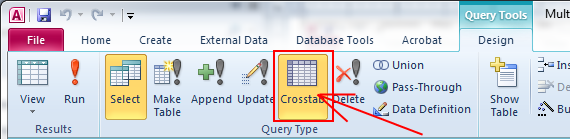
- Now at the top under the Design Tab, choose the Query Type to include CrossTab
- You now need to go through below and add the various fields you want in the Query. When creating a Crosstab query you need to keep a few things in mind
- You may have as many fields as you wanted marked as “Total=Group By” and “Crosstab=Row Heading”,
- You may have only ONE field marked as “Total=Group By” and “Crosstab=Column Heading”, and
- You may have only ONE field marked as “Crosstab=Value”
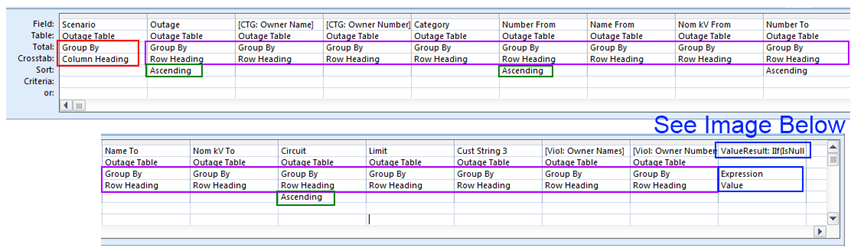
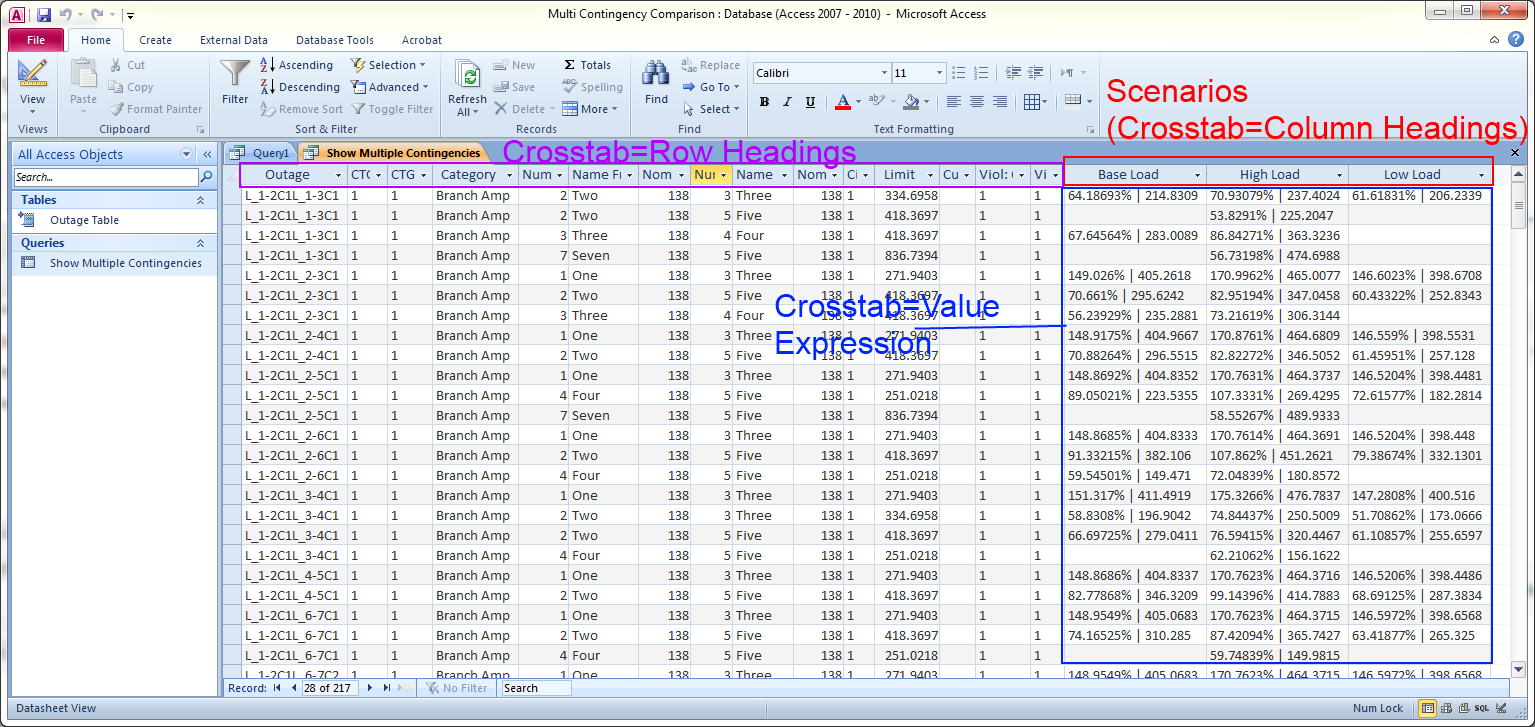
- Anyway, in this example go through an choose the following sets of fields such that
- Many different identifying fields are assigned to Crosstab=Row Heading as denoted by the purple boxes below. All entries in the “Outage Table” which have a unique combination of these Row Heading fields will be treated as a row in the final table generated from this query.
- Scenario is assigned to Crosstab=Column Heading as denoted by the red box below. Unique entries for Scenario will result in special columns at the end of the table.
- A special “Expression” we will explain in a moment is assigned the Crosstab=Value as denoted by the blue box below.
- In addition sorting is used appropriately as denoted by the green boxes below.
- The fields should something like as follows
Now we need to explain the last step. The Crosstab functionality only allows ONE field to be the Crosstab=Value field. This is essentially the text in the “matrix” of results. In this example we want to show both the line loading in Amps AND the line loading in percent. In order to do this we must create an Expression that concatenates these two fields into one field. This is done as follows
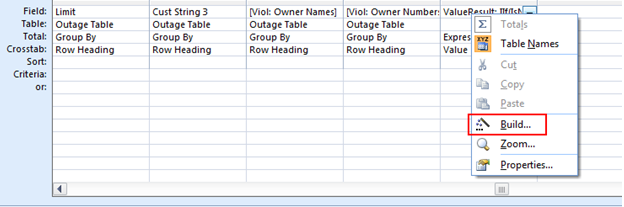
- On the field where you would like to define the Expression, right click on the Field and choose Build…
- This will bring up a dialog in which you can write special scripting used within Access to build expressions. The dialog looks as follows

- The string which is entered in the expression in this example is as follows
ValueResult: IIf(IsNull(First([Percent])),"",First([Percent]) & "% | ") & IIf(IsNull(First([Value])),"",First([Value]))
- It is import to make good use the the IIf(), IsNull() and First() commands here, but we will leave it to the reader to go interrogate the help documentation within Microsoft Access to learn more about this.
You may download this sample Access database at the following link: Multi Contingency Comparison.accdb. With this completed, you may now simply Run the Query in Access to build the results we want. Once you get the hang of this you can do it over and over again. It will look something like the following
For a more advanced user, you can also see this query or write this query directly as a SQL query. To view it simply right-click on the Query tab and choose SQL View
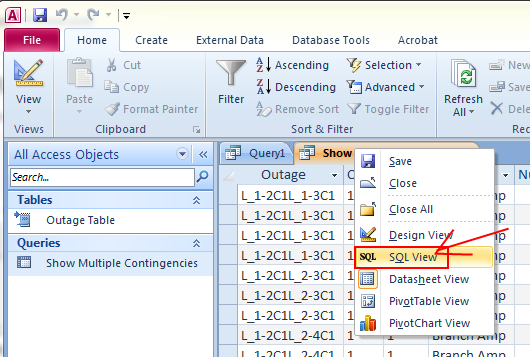
You can then see the SQL syntax for this command as follows:
TRANSFORM IIf(IsNull(First([Percent])),"",First([Percent]) & "% | ") & IIf(IsNull(First([Value])),"",First([Value])) AS ValueResult

SELECT [Outage Table].Outage, [Outage Table].[CTG: Owner Name], [Outage Table].[CTG: Owner Number], [Outage Table].Category, [Outage Table].[Number From], [Outage Table].[Name From], [Outage Table].[Nom kV From], [Outage Table].[Number To], [Outage Table].[Name To], [Outage Table].[Nom kV To], [Outage Table].Circuit, [Outage Table].Limit, [Outage Table].[Cust String 3], [Outage Table].[Viol: Owner Names], [Outage Table].[Viol: Owner Numbers]

FROM [Outage Table]

GROUP BY [Outage Table].Outage, [Outage Table].[CTG: Owner Name], [Outage Table].[CTG: Owner Number], [Outage Table].Category, [Outage Table].[Number From], [Outage Table].[Name From], [Outage Table].[Nom kV From], [Outage Table].[Number To], [Outage Table].[Name To], [Outage Table].[Nom kV To], [Outage Table].Circuit, [Outage Table].Limit, [Outage Table].[Cust String 3], [Outage Table].[Viol: Owner Names], [Outage Table].[Viol: Owner Numbers]

ORDER BY [Outage Table].Outage, [Outage Table].[Number From], [Outage Table].[Number To], [Outage Table].Circuit

PIVOT [Outage Table].Scenario;
In the terms used by Access you can think of this simply as follows
- TRANSFORM defines the “Value” of the Crosstab and uses an expression to do it
- SELECT chooses the table values
- FROM specifies which table to SELECT in
- GROUP BY specifies the “Row Heading”
- PIVOT specifies the “Column Heading”
November 15, 2013