New PowerWorld Simulator-Created Images
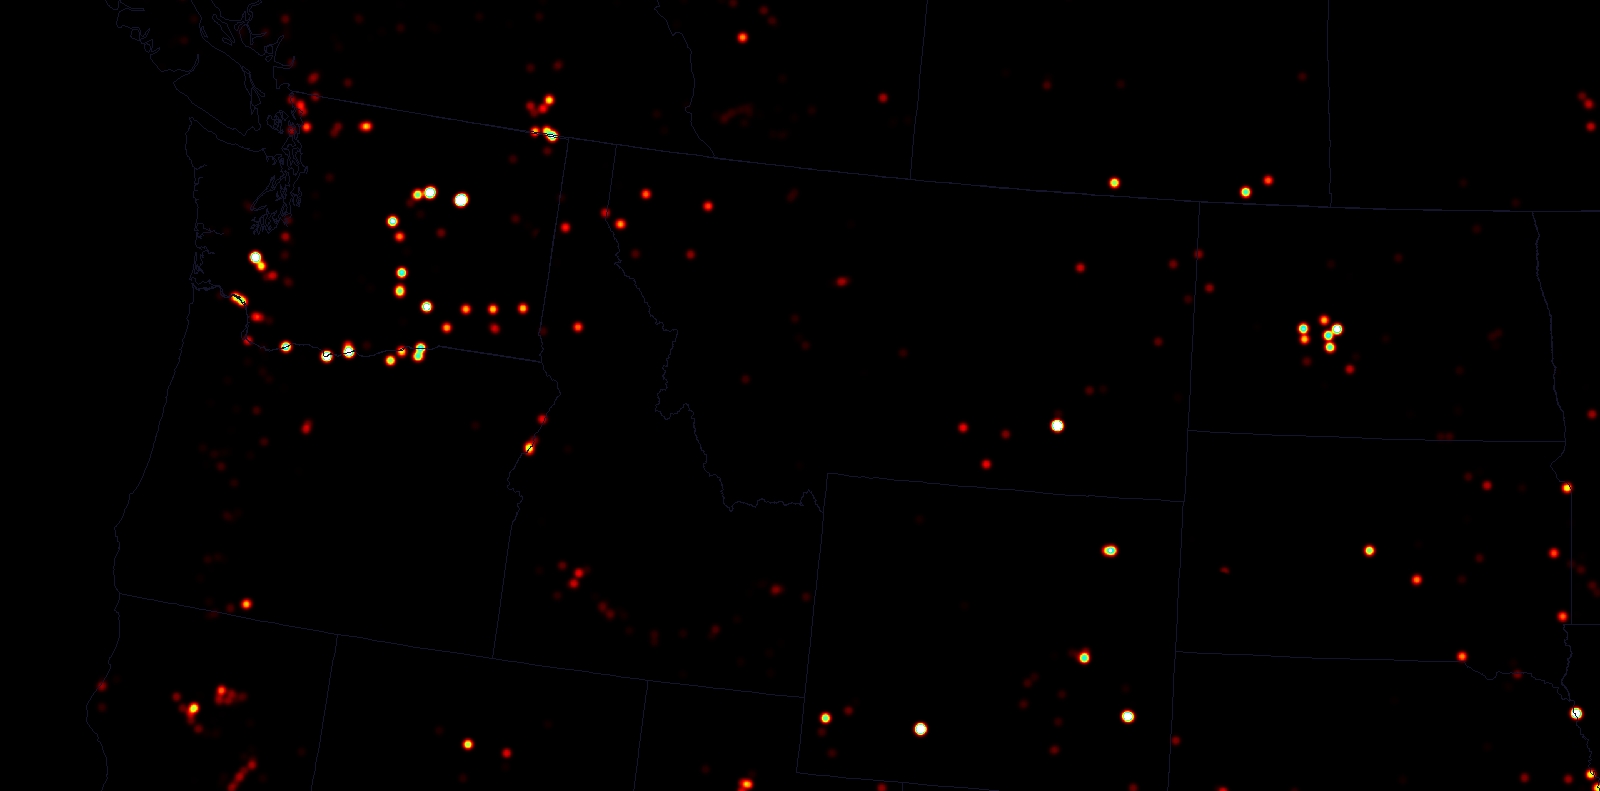
PowerWorld founder Professor Tom Overbye created these rich images in PowerWorld Simulator using a one-line diagram and unified North American power flow models. They demonstrate how Simulator can be used to provide “overview” visualizations, that might be of interest to a wide audience that might include management, media, government, and the general public. The images are all based on power flow models of peak summer 2014 conditions.
- Load density is conveyed through a black/white color scale. The coloring mimics commonly shown “night lighting” satellite photographs.
- This image combines load (green scale) with generation (red scale) to convey the relative locations of each.
- Power generation stations are shown power with a modified spectrum scale (black-red-yellow-light blue). A large number of relatively small wind farms are revealed with red dots.
- Generation stations zoomed on the Pacific Northwest. The Columbia and Snake Rivers are recognizable by their series of hydroelectric stations.


