The Plot Designer sub-tab is found on Plots page of the Transient Stability Analysis dialog and the PV Curve dialog. The vast majority of features for plotting are common to both Transient Stability and PV Curves. In cases where there is a difference in functionality it will be denoted in the help documentation.
Settings on this page determine which results will be plotted and when the plots will be made visible during the transient stability analysis.
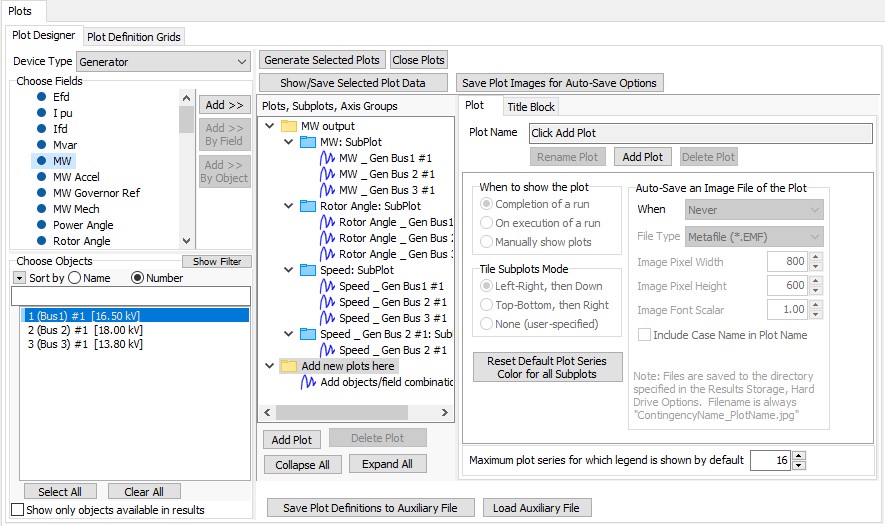
The Plot Designer page is broken into three main sections. The left side of the page allows for the selection of devices and fields that should be included in a plot. The middle section defines the plots that are created and how these should be defined in terms of subplots and axis groups. The right section of the page allows modification of all of the plot components. The dialog is shown below.

Creating a New Plot
A new plot can be created in a number of ways:
- If no existing plot exists, simply selecting a Device Type, Choose Fields, and Choose Objects and then clicking the Add >>, Add >> Group Fields, or Add >> Group Objects buttons will create a new plot with a default name. (You may also drag a selection of fields over to the middle section listing the plot components to create a new plot).
- Click the Add Plot button found under the Plots, Subplots, Axis Groups list. A prompt will appear asking for the name of the plot. Enter the name and click OK. Then use the Device Type, Choose Fields, and Choose Objects options and the Add >> buttons to add data to a plot.
- Right-click on the Plots, Subplots, Axis Groups list and select Add Plot. A prompt will appear asking for the name of the plot. Enter the name and click OK. Then use the Device Type, Choose Fields, and Choose Objects options and the Add >> buttons to add data to a plot.
- Click the Add Plot button found on the Plot sub-tab that is part of the Plots, Subplots, Axis Groups section. A prompt will appear asking for the name of the plot. Enter the name and click OK. Then use the Device Type, Choose Fields, and Choose Objects options and the Add >> buttons to add data to a plot.
- Select fields and objects in the Results to Save tables.
- From the list of Transient Limit Monitor Violations.
Right Section: Editing of Plot Definition
Most of the topic below discusses the creating of plot components. After plot components are created, selecting a particular plot component (plot, subplot, axis group, plot series) from the list in the middle of this portion of the dialog will change the sub-tabs that are available to the right of the list. Each of these sub-tabs allows for modifications of the different plot components as well as the components in which a particular component is contained, e.g. selecting a plot series will allow for modification of that particular series as well as the axis group in which the series is contained, the subplot in which the axis group is contained, and the plot in which the subplot is contained. Options can be changed for a plot before the plot is generated or while the plot is showing. Changing any of the options on the sub-tabs described below will update the current plot. Possible sub-tabs are as follows:
Device Type
Select the device type from the drop-down of all allowed types. Changing the device type will update the Choose Fields and Choose Objects accordingly.
Choose Fields
Choose the fields to be added to a plot. Multiple fields can be selected by holding down the CTRL key and selecting individual fields with the mouse, or holding down the Shift key and selecting the beginning and ending of a range with the mouse. You may also left-click and drag a list of fields here over to the middle section showing a list of plot components.
Dynamic States, Other Fields and Inputs (For Transient Stability Only)
At the top of the field list is a list of the common fields which can be saved as part of the Results Storage. For some types of objects, below this are several folders showing either Dynamic Model Input Fields, Dynamic Model Other Fields, or Dynamic Model States. The states represent the actually states of the dynamic equations of the mode. Other field represents other values of interest for the object which are not actually a state variable. Finally the input fields represent special input values to the dynamic model. Examples of input fields are the governor setpoint (Pref) and the exciter setpoint (Vref).
The entries underneath these folders will change as you select different objects from the Choose Objects pane. By default the entries will be very generic saying "Input 1", "Other 1", "State 1", "State 2", etc... If the selected object has a dynamic model associated with it then the entries will change to reflect this. If multiple objects are selected then the entries will only change if all objects selected have the same name for the specified State, Input, or Other field.
Choose Objects
Choose the objects to be added to a plot. Multiple fields can be selected by dragging the mouse down a selection, holding down the CTRL key and selecting individual fields with the mouse. The font colors of the objects lists in this list indicate whether any results are available for plotting presently. Black text indicates that there are no results available. Green text indicates that values are stored in RAM for this object. Blue text indicates that values are stored on the Hard Drive for this object.
Add >>
When clicked the selected fields and objects will be added to the appropriate plot component. Fields are selected from the Choose Fields list and objects are selected from the Choose Objects list. This button is enabled under the following conditions if at least one field and one object are selected:
Plot selected that contains only one subplot and one axis group - plot series for each field and object will be added to the selected plot in the single axis group and subplot
Subplot selected that contains only one axis group - plot series for each field and object will be added to the selected subplot in the single axis group
Axis group selected - plot series for each field and object will be added to the selected axis group
In any of these case if a plot series already exists for the selected field and object, a new plot series will not be added.
Add >> Group Fields
When clicked the selected fields and objects will be added to the appropriate plot component. Fields are selected from the Choose Fields list and objects are selected from the Choose Objects list. This button is enabled under the following conditions if at least one object and more than one field are selected:
Plot selected that contains only one subplot - axis groups will be created for each of the selected fields and plot series for each of the selected objects will be placed in each new axis group
Subplot selected - axis groups will be created in the selected subplot for each of the selected fields and plot series for each of the selected objects will be placed in each new axis group
Axis group selected - axis groups will be created in the subplot that contains the selected axis group. A new axis group will be created for each of the selected fields and plot series for each of the selected objects will be placed in each new axis group.
In any of these cases if an axis group for a selected field already exists in the corresponding subplot, a new axis group will not be created, but the plot series will be added to the existing axis group. If a plot series for a selected object already exists in the axis group, a new plot series will not be added. For an axis group to exist for a selected field, the axis group can only contain plot series for that particular field.
Add >> Group Objects
When clicked the selected fields and objects will be added to the appropriate plot component. Fields are selected from the Choose Fields list and objects are selected from the Choose Objects list. This button is enabled under the following conditions if at least one field and more than one object are selected:
Plot selected that contains only one subplot - axis groups will be created for each of the selected objects and a plot series for each of the selected fields will be placed in each new axis group
Subplot selected - axis groups will be created in the selected subplot for each of the selected objects and plot series for each of the selected fields will be place in each new axis group
Axis group selected - axis groups will be created in the subplot that contains the selected axis group. A new axis group will be created for each of the selected objects and plot series for each of the selected fields will be place in each new axis group.
In any of these cases if an axis group for a selected object already exists in the corresponding subplot, a new axis group will not be created, but the plot series will be added to the existing axis group. If a plot series for a selected field already exists in the axis group, a new plot series will not be added. For an axis group to exist for a selected object, the axis group can only contain plot series for that particular object.
Generate Selected Plots
Click this button to generate plots for those selected in the Plots, Subplot, Axis Groups list. For a plot to be selected either the plot itself or one of its components needs to be selected. When generating a plot, an attempt will be made to retrieve from the results stored to RAM. If results are not available for a particular plot series in RAM, then results will be retrieved from those values stored to Hard Drive. If they are still not available then a plot will be generated which omits any plot series for which data can not be retrieved.
Close All Plots
Click this button to close all open plots.
Show/Save Selected Plot Data
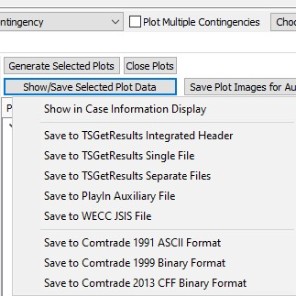
Click this button to open a drop down menu:

The first option is to open a case info display. Also the plot data can be save with the TSGeResults in integrated Header, Single File and Separate files. If the Trasnient Stability tool is in multiple contingencies mode and the Plot Multiple Contingencies option is selected the Save to TSGeResults will save all the plot data of all the contingencies depending on the option the user selects. Other options to save plot data results are to save it as a PlayIn auxiliary file, a WECC JSIS file, and also to save the data in Comtrade 1991 ASCII format, 1999 Binary format and 2013 CFF Binary format.
Save Plot Definitions to Auxiliary File
Click this button to save all of the plot definitions to an auxiliary file. This is useful when running analyses on power system models with common devices.
Plots, Subplots, Axis Groups
This is a listing of all plots that have been created along with associated subplots, axis groups, and data series. The list is arranged as a group of folders. Each plot is contained in its own folder. If there is more than one subplot for a plot, each subplot will be contained in a folder. Each subplot then contains a list of axis groups. If there is more than one axis group for a subplot, each axis group will be contained in a folder. Each axis group then contains a list of the plot series that it contains.
When adding devices and fields to a plot, the plot component selected in this list will determine where the data will be added when clicking one of the Add >> buttons. The Add >> buttons will be enabled according to the component selected in this list and the combination of devices and fields selected in Choose Fields and Choose Objects. Note you may also drag a list of fields from the Choose Fields portion of the dialog over to this listing to add new plots or add new plot series to the respective plot component.
There are several buttons located at the bottom of the plot listing. These buttons affect what and how things are shown in the list.
Add Plot
Click this button to add a new plot to the list.
Delete
The caption and functionality of this button will change depending on the particular type of plot component that is selected in the list. Clicking this button will then delete the selected component and any other components that are contained in the selected component. For example, if an axis group is selected and the Delete button is clicked, all plot series contained in the axis group will be deleted along with the axis group.
Note: you may also delete plot components by dragging them from this listing over to the Choose Fields pane.
Collapse All
Click this button to collapse all folders in the list.
Expand All
Click this button to expand all folders in the list.
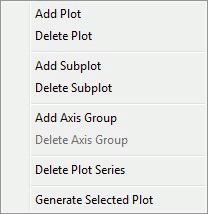
Right-clicking on components in the list will open a local menu that allows various options for adding or deleting plot components. The options that are available will change depending on the component selected.

Components can be moved from one plot to another or from one component to another by simply clicking and dragging the component to the new location. The new location must be a valid component that can contain the component being moved or the parent component for the new location must be able to contain the component being moved. For example, a subplot can be moved and dropped on an axis group with the subplot being placed in the plot containing the axis group.
Note: you may also delete plot components by dragging them from this listing over to the Choose Fields pane.