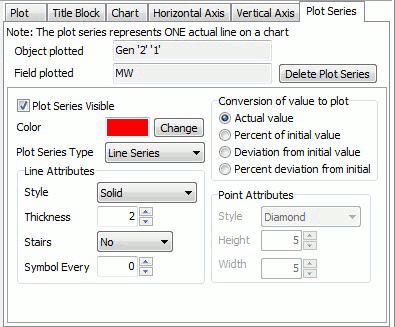
The Plot Series sub-tab is available on the Transient Stability Analysis dialog and the PV Curve dialog on the Plot Designer sub-tab of the Plots page. The vast majority of features for plotting are common to both Transient Stability and PV Curves. In cases where there is a difference in functionality it will be denoted in the help documentation.
This tab provides information about the plot series that is currently selected in the Plots, Subplots, Axis Groups list found on the Plot Designer sub-tab.

Object plotted
This shows the object that is represented by the selected plot series. This is for informational purposes only and cannot be changed here.
Field plotted
This shows the field that is represented by the selected plot series. This is for informational purposes only and cannot be changed here.
Delete Plot Series
Click this button to delete the selected plot series.
Plot Series Visible
Check this box for the plot series to be shown on the plot.
Color
Click the color box or the Change button to select the color of the line drawn for the plot series.
Plot Series Type
Select whether the plot series should be shown by a Line Series or a Point Series. If shown by a Point Series, the Point Attributes options will be enabled allowing selection of the style and size of the points.
Line Attributes
These options will only be enabled if the Plot Series Type is a Line Series.
Style
Solid, Dashed, Dot, Dash Dot, and Dash Dot Dot are the valid options for the line style.
Thickness
Set the thickness of the line.
Stairs
Select whether the line series should be drawn with No stairs, Stair, or Inverted stair. The stair options connected successive points in a stair pattern instead of a straight line.
Symbol Every
Set this option to something other than zero if a symbol should be placed on the line for better identification. Making this value larger will make the symbol placing less dense. Use the Point Attributes options to define the style and size of the symbols.
Conversion of value to plot
These options will allow to have plots based on the following options: Actual value, Percent of initial value, Deviation from initial value, or Percent deviation from initial.
Point Attributes
These options will only be enabled if the Plot Series Type is a Point Series or choosing to include symbols on a Line Series by setting the Symbol Every option to something other than zero.
Style
This determines the shape of any plot series symbols.
Height
This sets the vertical size of the plot series symbols.
Width
This sets the horizontal size of the plot series symbols.