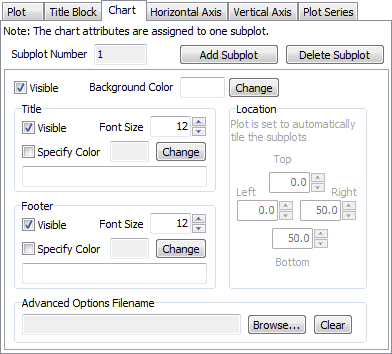
Plot Designer: Chart
The Chart sub-tab is available on the Transient Stability Analysis dialog and the PV Curve dialog on the Plot Designer sub-tab of the Plots page. The vast majority of features for plotting are common to both Transient Stability and PV Curves. In cases where there is a difference in functionality it will be denoted in the help documentation.
This tab provides information about the subplot that is currently selected in the Plots, Subplots, Axis Groups list found on the Plot Designer sub-tab. A subplot is selected if any of its corresponding axis groups or plot series are selected in the list.

The Chart portion of the subplot is the background, header, and footer of the subplot.
Subplot Number
This is an informational field. Each subplot is assigned a number when it is created. The user cannot change this value.
Add Subplot
Click this button to add a subplot to the currently selected plot.
Delete Subplot
Click this button to delete the currently selected subplot.
Visible
Check this box to make the subplot visible when its corresponding plot is shown.
Background Color
Click the color box or the Change button to select a new color for the chart background.
Title
Check the Visible box to make a chart title shown. Check the Specify Color box and choose an desired color to specify a font color for the title. Specify the Font Size and the actual title text in the box provided. Special strings may be entered, preceded by a '@' symbol, which will be automatically interpreted as an appropriate string to place in the title. A short list is below, but a more complete list of options is found in the Special Strings for Plot Features help topic.
@CTGName will display the appropriate contingency name
@CTGEvents will show the transient result event.
@CTGMemo will show the memo of the transient contingency in the plot.
@CASENAME will show the name of the case presently open.
@BUILDDATE will show the Simulator patch build date. @DATETIME will show the present date and time.
@DATE will show the present date.
@TIME will show the present time.
Footer
Check the Visible box to make a chart footer shown. Check the Specify Color box and choose an desired color to specify a font color for the footer. Specify the Font Size and the actual footer text in the box provided. Special strings may be entered, as described above.
Location
Set the Top, Bottom, Left, and Right location of the subplot within the plot window if choosing the option for user-specified subplot locations with the Tile Subplots Mode option found on the Plot sub-tab.
Advanced Options Filename
There are a number of advanced options associated with a chart that are only accessible through the local menu found on each subplot. This option allows a file containing these advanced options to be associated with the current subplot. If a file is specified, the advanced options contained in that file will be used when generating the subplot. Use the Browse button to browse for a file and use the Clear button to no longer associate a file with the current subplot. For more information about the advanced options, see the Navigating Around a Plot, Advanced Options section.