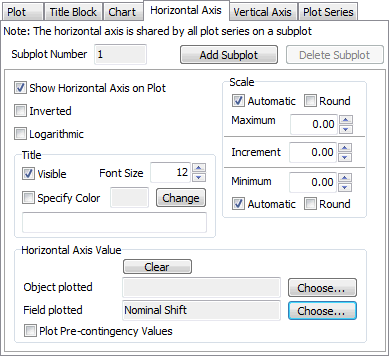
Plot Designer: Horizontal Axis
The Horizontal Axis sub-tab is available on the Transient Stability Analysis dialog and the PV Curve dialog on the Plot Designer sub-tab of the Plots page. The vast majority of features for plotting are common to both Transient Stability and PV Curves. In cases where there is a difference in functionality it will be denoted in the help documentation.
This tab provides information about the subplot that is currently selected in the Plots, Subplots, Axis Groups list found on the Plot Designer sub-tab. A subplot is selected if any of its corresponding axis groups or plot series are selected in the list.

The horizontal axis is shared by all plot series on the selected subplot.
Subplot Number
This is an informational field. Each subplot is assigned a number when it is created. The user cannot change this value.
Add Subplot
Click this button to add a subplot to the currently selected plot.
Delete Subplot
Click this button to delete the currently selected subplot.
Show Horizontal Axis on Plot
Check this box to show the horizontal axis on the current subplot.
Inverted
Check this box to have the scale on the horizontal axis go from high to low values when moving left to right along the axis.
Logarithmic
Check this box to use a logarithmic scale on the horizontal axis of the current subplot.
Title
Check the Visible box to make a horizontal axis title shown. Check the Specify Color box and choose an desired color to specify a font color for the title. Specify the Font Size and the actual title text in the box provided. Special strings may be entered, preceded by a '@' symbol, which will be automatically interpreted as an appropriate string to place in the title. A short list is below, but a more complete list of options is found in the Special Strings for Plot Features help topic.
@CTGName will display the appropriate contingency name
@CTGEvents will show the transient result event.
@CTGMemo will show the memo of the transient contingency in the plot.
@CASENAME will show the name of the case presently open.
@BUILDDATE will show the Simulator patch build date. @DATETIME will show the present date and time.
@DATE will show the present date.
@TIME will show the present time.
Scale
Maximum
Check the box next to Automatic to have the maximum value on the scale automatically determined based on the results or uncheck this box and specify the value manually. Check the box next to Round to have the maximum value rounded when the Automatic checkbox is also checked.
Increment
Specify the increment between scale markings. If zero is specified, the increment will be determined automatically.
Minimum
Check the box next to Automatic to have the minimum value on the scale automatically determined based on the results or uncheck this box and specify the value manually. Check the box next to Round to have the minimum value rounded when the Automatic checkbox is also checked.
Horizontal Axis Value
The horizontal axis value is normally chosen to be time. This is the default if nothing else is selected. However, the option is allowed to choose a different value for the horizontal axis.
Clear
Click this button to restore the horizontal axis value to the default of Time.
Object Plotted
Select an object to be used for the horizontal axis values.
Field Plotted
Select the field for the associated object to be used for the horizontal axis values.
When no object is specified, this choices are a list of independent values tracked by the tool. For Transient Stability, this is Time in Seconds. For the PV analysis, this includes Nominal Shift, Export, and Import.
Plot Pre-Contingency Values
If the Pre-contingency box is checked, the x values for each plotted scenario will come from the base case instead of the results of a given scenario.