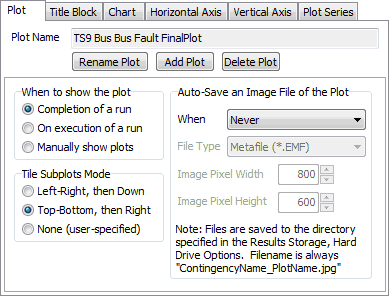
The Plot sub-tab is available on the Transient Stability Analysis dialog and the PV Curve dialog on the Plot Designer sub-tab of the Plots page. The vast majority of features for plotting are common to both Transient Stability and PV Curves. In cases where there is a difference in functionality it will be denoted in the help documentation.
This tab provides information about the Plot that is currently selected in the Plots, Subplots, Axis Groups list found on the Plot Designer sub-tab. A plot is selected if any of its corresponding subplots, axis groups, or plot series are selected in the list.

Plot Name
Name of the currently selected plot.
Rename Plot
Click this button to rename the currently selected plot. A dialog box will open in which the new plot name should be entered. Click OK on this dialog to change the plot name or Cancel to abandon the change.
Add Plot
Click this button to create a new plot. A dialog will open prompting for a name for the new plot. Click OK to create the new plot or Cancel to abandon the addition.
Delete Plot
Click this button to delete the currently selected plot.
When to show the plot (Only available for Transient Stability Plots)
Set this option to determine when a plot should be shown. A plot can automatically be shown at the completion of a stability run or on execution of a stability run. If showing on execution, the plot will be updated as the analysis progresses. If set to be shown manually, the plot must be selected in the Plots, Subplots, Axis Groups list found on the Plot Designer page and the Generate Selected Plots button must be clicked in order to be shown. A plot can be shown manually in this manner at any time even if one of the options to show the plot automatically is selected.
Tile Subplots Mode
This option will only be enabled if a plot contains more than one subplot. This option dictates how the subplots will be placed within the plot window. If choosing None (user-specified locations), the location of the subplot should be specified with the Location option found on the Chart sub-tab.
Auto-Save an Image of the Plot (Only available for Transient Stability Plots)
Specify when and how plot images are saved to the Results Storage Hard Drive location. When defines when images are stored (can be Never, After each contingency, Multiple Plot at the end, or Both). File Type defines the format the image being saved (can be a Metafile *.EMF, JPEG *.jpg, Bitmap *.bmp, or a GIF *.gif). Image Pixel Width/Height specifies the dimensions of the saved image.
When storing After each contingency if ONLY Save Results to Hard Drive is checked on the Result Storage tab, make sure the fields that are plotted are also set to be stored to hard drive. Set the fields to be stored under the Save to Hard Drive Options on the Result Storage tab. Not doing this could result in empty plots or plots without certain fields plotted.
Added in version 19, build on May 31, 2017. When choosing to auto-save an image of a plot to file and choosing to not store results to RAM, the image will be saved to file and then memory will be cleared of the results needed for the plot. Because nothing is saved to memory after the image is stored to file, the plot cannot be regenerated manually unless the plot information has also been stored to hard drive.
Added in version 20, build on Jun 11, 2020. A file type of PDF (*.PDF) may also be specified. When choose a PDF file type, then all plots for which PDF file is chosen for the same transient contingency will be saved to a single PDF document. Each page of the PDF document will represent one plot with the pages in the same order as the plots are defined in the user interface. As part of this addition, the Image Font Scalar was also added. The image Font Scalar can be set to above 1.0 to ensure when a large Pixel Width/Height is chosen then the fonts can scale to a larger size so they can be read.