The Plots page is found on the Transient Stability Analysis dialog and the PV Curve dialog. The vast majority of features for plotting are common to both Transient Stability and PV Curves. In cases where there is a difference in functionality it will be denoted in the help documentation.
The Plots page is broken into two sub-tabs that provide the means for creating and modifying plots:
This page is used to create and modify plots.
Plot Definition Grids
This page provides summary case information displays of the various components comprising a plot: Plots, Sub Plots, Axis Groups, and Plot Series. Once plots have been created using the Plot Designer, they can be modified through the Plot Definition Grids. These grids also provide the format in which plots are stored in auxiliary files.
Once you have created a plot see the User Interaction with Plots for many ways to interact with that plot to better view the results.
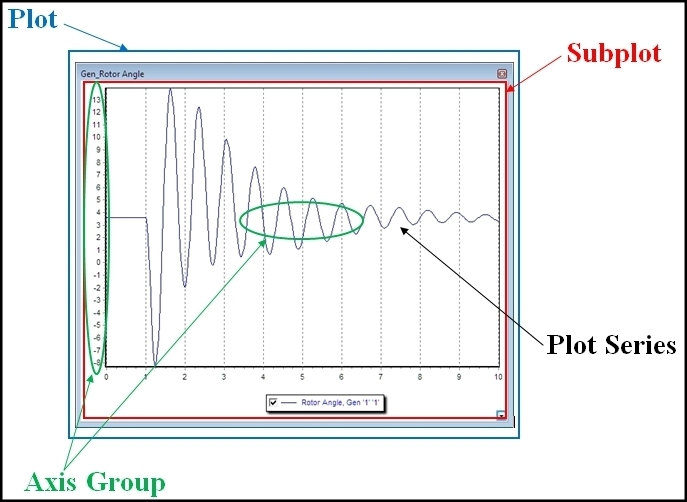
Plotting of transient stability results is an integral part of a transient stability tool. It is a primary mechanism through which transient stability results are viewed. Simulator has been designed to give a great deal of flexibility in the design of your plots allowing for multiple charts on a single plot as well as multiple vertical axes on a single chart. To discuss this in detail let us first define four objects which make up a plot definition
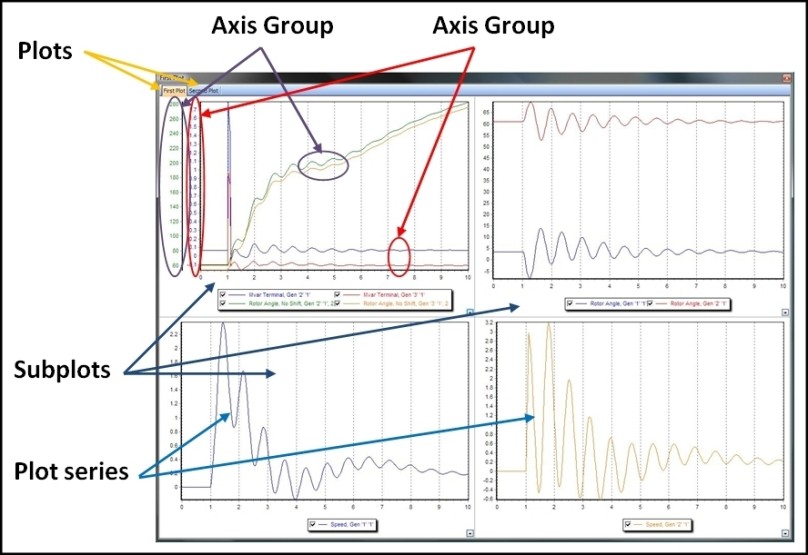
- Plot : a single window showing plotted results which may consist of 1 or more subplots
- Subplot: A subplot represents the actual graphical chart. It contains a single horizontal axis which is shared by all plot series contained in the subplot. The subplot contains one or more axis groups which represent vertical axes. For many plots there will be only one subplot
- Axis Group : A single axis group may contain many plot series. A single axis group represents a vertical axis which is shared by all the plot series it contains. For many subplots there will be only one axis group.
- Plot Series : A single plot series is a graphical line representing the trace of one numeric data series. For instance it may be the frequency of a particular bus.
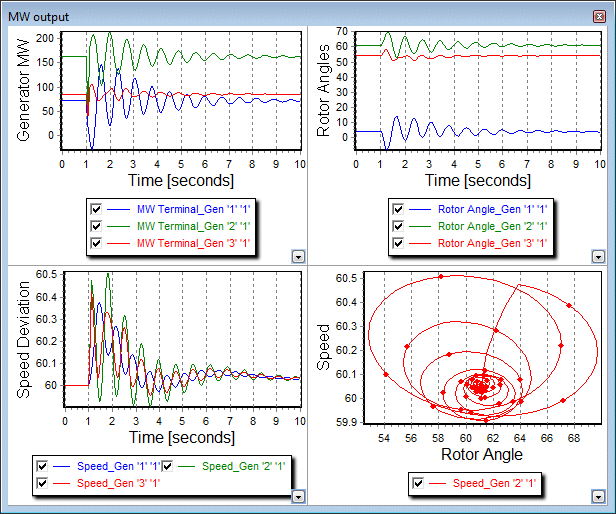
As a simple example, consider the figure on the first figure below showing a plot that contains one subplot, that contains 1 axis group, that contains 1 plot series. Plots may also be much more complex as shown by the second figure below which has multiple subplots and multiple axis groups. Finally, the bottom-right subplot of the third example shows a subplot using a horizontal axis which is different than Time and thus shows a state space plot.

A more complicated example consisting of multiple plots, subplots, axis groups, and plot series is shown below:

