Multiple Scenario ATC Dialog: Results
The Results page of the Multiple Scenario ATC Analysis is available on the Available Transfer Capability dialog when selecting the option to Analyze Multiple Scenarios on the Advanced Options tab of the Available Transfer Capability dialog.
Once you have defined your scenarios and started the ATC Analysis, you can switch to the Results page to see the progress that ATC Analysis is making.
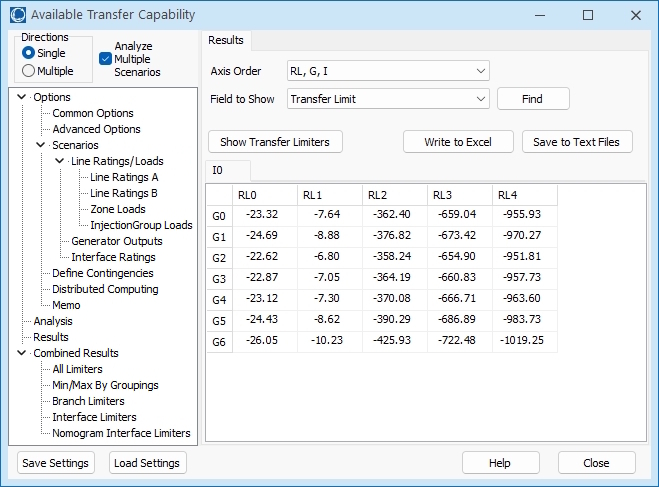
The primary part of the Results page contains a spreadsheet-like look-up table display. The layout of the display is dictated by the Axis Order selected. Note that because there are three axes possible, the row and column entries represent the first two axes while the third axis is represented by tabs at the top of the table. See Local Menu Options for information regarding the options available when right-clicking within the table.
This dialog has the following controls:
Axis Order
This menu is used to select the desired axis order. The three axes correspond to the three Scenarios tabs.
- One axis has heading labels G0, G1, … for the Generation Scenarios,
- Another with heading labels RL0, RL1, … for the Rating/Load Scenarios,
- A third with heading labels I0, I1, … for the Interface Scenarios.
Field to Show
Use this dropdown to select which field is shown in the Results Display. By default this is set to Transfer Limit, but any field associated with a transfer limiter can be displayed. Click the Find button to open a dialog that allows search options for determining which field to select.
Show Transfer Limiters
Click the Show Transfer Limiters button to view the Transfer Limiters found under each scenario. This will open a separate dialog that displays a list of the Transfer Limiters. To see the Transfer Limiters for a particular scenario, click on the workbook cell that represents the scenario you are interested in and the separate dialog will update appropriately.
Write to Excel
This button will send the results to an Excel spreadsheet.
Save to Text Files
This option will allow the user to save the results in an auxiliary file.
Results Display
The primary part of the Results tab contains a spreadsheet-like look-up table display. The values shown in the table for each scenario are for the field selected with the Field to Show option. By default this is the Transfer Limit. The value that is reported corresponds to the transfer limiter with the most limiting Transfer Limit. If using one of the iterated methods, the most limiting Transfer Limit is determined from all limiters that have been iterated on.