PV Curves: QV Setup
Removed in version 24
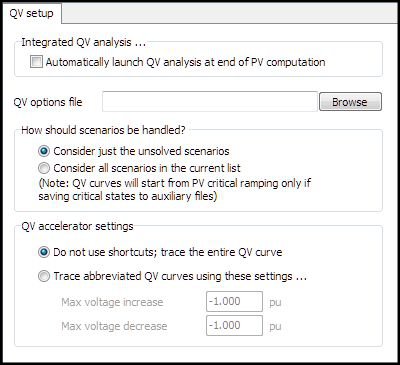
The QV Setup tab is found on the PV Curves dialog. This page provides options for setting up a QV analysis and for automatically launching the QV analysis upon completion of the PV analysis.
When using Integrated Topology Processing, the automatic launching of the QV analysis is disabled.
The PV curve tool stresses the system by increasing a transfer between injection groups. Eventually, the transfer is increased so much that the power flow can no longer be solved. Under the assumptions of static voltage stability assessment, the point at which the system becomes unsolvable is regarded as the point of voltage collapse. Voltage collapse tends to be a localized phenomenon associated with a lack of reactive voltage support at a bus or group of connected buses. It is important to identify this group of stressed buses so that efforts can be properly directed to reinforce the system. QV analysis is often used to identify the buses that are most prone to a voltage collapse because they are close to having insufficient reactive support.
The design of the PVQV add-on to Simulator acknowledges the important role that QV analysis plays in identifying the buses that are most heavily stressed by a transfer. The approach is straightforward. First, perform a PV curve analysis that models a transfer from source to sink for both base and contingency topologies. This will yield a number of PV curves that terminate at a transfer level that causes the system to become unsolvable for each topology. For each of these critical transfer level / contingency pairs, perform a QV analysis at a set of buses to try to determine which area or areas constitute the epicenter of the collapse. The set of buses at which the QV analysis is performed can be predefined by the user and supplemented by the list of buses that have the lowest voltage magnitudes or the highest VQ sensitivities.
To specify that the QV analysis automatically be launched after finishing a PV study, check the box labeled Automatically launch QV analysis at end of PV computation. After the PV curve has found all the critical cases it has been asked to identify, it will launch the QV Curve Tool. The buses the QV Curve Tool will analyze will then come from two groups: those that the user has pre-selected, and those that the tool automatically identified because they are among the lowest-voltage buses or have the highest VQ sensitivities. Whether or not to include the lowest-voltage buses or highest VQ sensitivity buses are options that need to be set by the user. Pre-selected buses for the QV analysis must also be set by the user. All of these options need to be specified in the QV options file that is required to be specified in order to automatically launch the QV analysis.
The remainder of the options that must be specified in order to perform the QV analysis automatically are described below:
QV options file
Specify the name of the file that contains settings for a variety of options associated with the QV study in this text box. Use the Browse button to locate this file using a file dialog. The QV options file should specify which buses should be selected for which to draw QV curves.
Among the topics that may be addressed by the QV options file is whether buses should be automatically selected as buses for which to draw QV curves based on their voltage or VQ sensitivity. The easiest way to build a QV options file is to use the QV Curve Tool to specify the settings of the various options and to save these settings in a file.
How should scenarios be handled?
QV curves can be drawn for the selected buses either for all the scenarios that the PV tool has processed (select Consider all scenarios in the current list) or just for the scenarios that the PV Curve tool determined to be critical (select Consider just the unsolved scenarios).
The transfer level at which a scenario is studied with the QV curve tool is based on other options that can be set with the PV tool. If choosing to archive states, and at a minimum archiving the critical scenarios, as set on the Output tab, critical scenarios will be studied at the last transfer level at which each scenario was successfully solved. Another condition is that the states must be saved as PowerWorld auxiliary (*.aux) files.
If not choosing to archive critical states, the critical state auxiliary file does not exist, or studying non-critical scenarios, the transfer level at which a scenario is studied in the QV curve tool is the last transfer level that the PV tool attempted to model. This transfer level is the level that is in place in the state that the case is left in upon completion of the PV analysis.
QV accelerator settings
This group of controls allows the definition of a voltage window over which each QV curve should be calculated.
Do not use shortcuts; trace the entire QV curve
Each QV curve will be computed over the voltage range specified for the bus in the QV options file. This voltage range may be specific to that bus or may be a window what has been defined for the entire run.
Trace abbreviated QV curves using these settings...
The voltage range over which each bus's QV curve will be computed will be customized according to the values specified for Max voltage increase and Max voltage decrease. For example, if a bus is currently at 0.9 pu voltage for a particular scenario and the max voltage increase is specified to be 0.1 with the max voltage decrease specified to be 0.3, the QV curve for that bus for that scenario will be traced over the voltage range 0.6 pu to 1.0 pu.