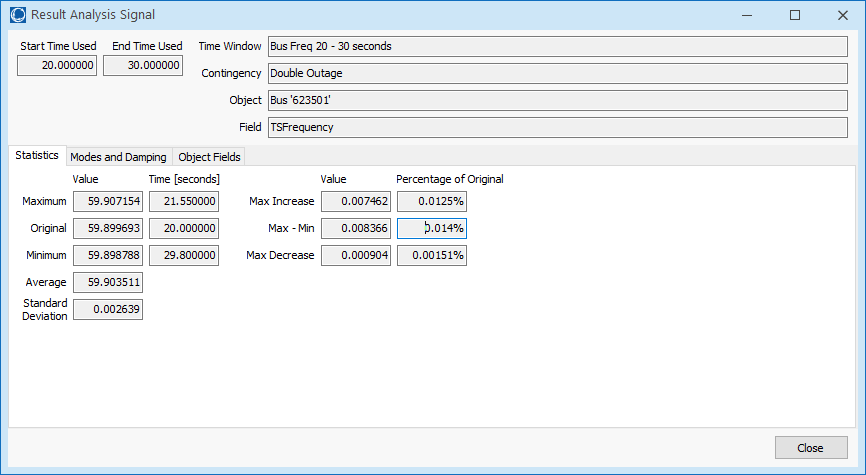
Result Analysis Signal Statistics (Added in Version 22)
When performing results analysis on defined Transient Stability Result Analaysis Time Windows, with every signal being analyzed and PowerWorld will store the original, maximum, minimum, average and standard deviation of the signal. The time at which the minimum and maximum occurred will also be stored. These values can then be presented in the table of Signal Statistics as shown in the first image below. In addition a dialog exists as shown second image below.
When looking at the statistics, the display is filtered to show only the contingency chosen from the contingency drop-down shown in the red box below. In addition to make filtering by particular time windows, there is a display listing all time windows in the blue box below. By checking or unchecking particular time windows the list of signals is filtered. Each row in the table represents a particular field of a particular object and we call each of these rows a "TSResultAnalysisSignal". The statistic values are then shown as columns.

