Sparklines
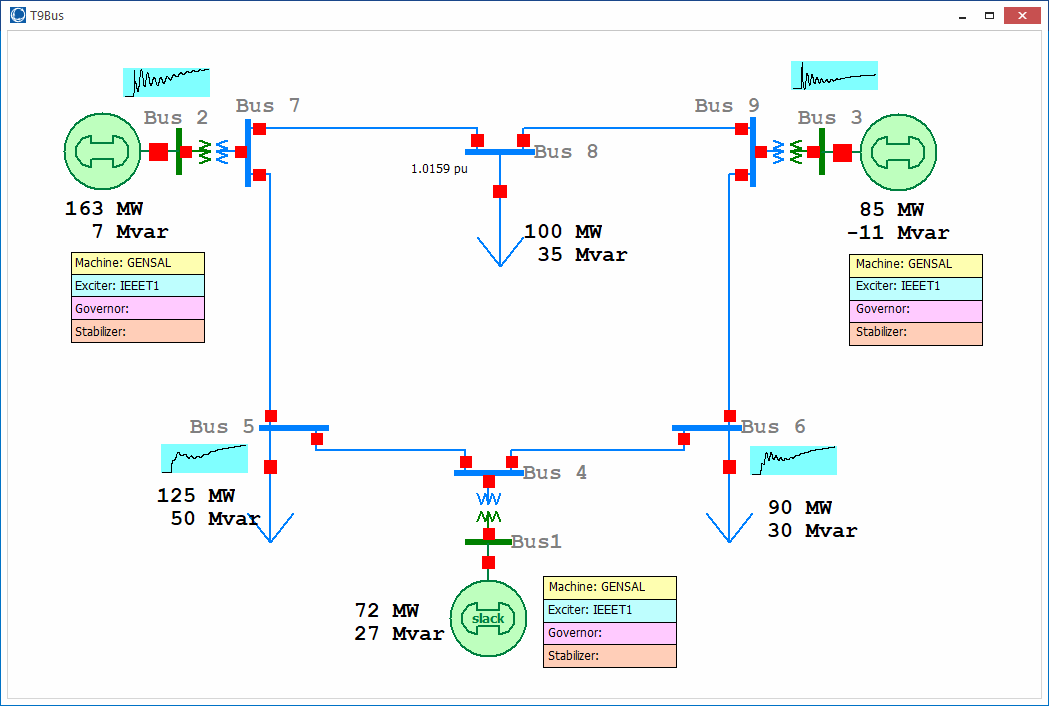
Sparklines are small character-sized graphics used to provide a quick representation of numerical information. They are used to represent the general shape of a value over time in a condensed form. They can be displayed instead of a field value when showing a field on a oneline diagram. Because they are only useful with a series of information, they can currently only be used with transient stability results.
Geographic Data Views also allow showing sparklines instead of field values. More information about how to use sparklines with geographic data views can be found with that topic.
Adding Sparklines from Oneline Field Dialogs
Oneline fields that allow the use of sparklines will contain a Draw Sparkline checkbox on their field option dialogs. This option will be located near the Find Field button that allows selection of the field to show. Sparklines are only allowed when using a field with the Select a Field option. When the Draw Sparkline checkbox is checked, the list of fields that are shown in the Choose a Field dialog and the field dropdown are limited to those fields that can be used with sparklines.
Additional options will appear on the field dialog when the Draw Sparkline checkbox is checked. These allow modification of how the sparkline is rendered.
Edit Sparkline Style
Click this button to open the Sparkline Style dialog. Typically the same style will be used for all objects of the same type that are showing the same field. See the Sparkline Style Dialog topic below for more information on how to define the style.
Style Name
Shows the name of the Sparkline Style being used. This field might be blank even though a style has been assigned. Typically the same style will be used for all objects of the same type that are showing the same field. If this situation a name does not have to be assigned to the style. Different styles for the same object type for the same field will require a unique name.
Override Ymin and Ymax with
Defaults for the Ymin and Ymax values shown on the y-axis of the sparkline will be determined automatically from the data that is being displayed. To override these defaults with user-specified values, check the box next to the correct limit, Use Ymin or Use Ymax, and specify the new value. The Ymin and Ymax values can be overridden.
Limits Actually Used
These values are informational only and show the limits of the data displayed on the sparkline.
Get Sparkline Values
Click this button to open a dialog showing the values being displayed on the sparkline.
Sparkline Style Dialog
The style of a sparkline determines how the chart is rendered and the limits used within the chart axes. Sparkline styles are defined with the oneline diagrams on which they are used and can be different for multiple onelines open with the same case.
The sparkline style dialog can be accessed by clicking the Edit Sparkline Style button found on a oneline field dialog or the Geographic Data View Customization Dialog.
The dialog contains the following options:
All Styles
This dropdown shows all available styles based on the selected object type and field.
Add New Style
Click this button to add a new style for the selected object type and field.
Object Type
Name of the object type for which the style is applicable. This cannot be changed on this dialog and will be set based on the object type selected prior to the sparkline style dialog being opened.
Variable Name
Variable name of the field for which the style is applicable. This cannot be changed on this dialog and will be set based on the field selected prior to the sparkline dialog being opened.
Style Name
Unique name of the style if more than one style exists for the same object type and field. This will be blank if only one style exists for a given object type and field.
Rename
Click this button to open a dialog that allows entering a new name for the presently selected style.
Thickness
This is the thickness of the chart line.
Color
This is the color of the chart line. To change the background color of the chart, use the Line/Fill properties found on the Format dialog and set the options to Use Background Fill and the Fill Color.
Width Ratio
As the height of the sparkline is changed, the width of the sparkline will retain this specified ratio relative to the height.
Margin X Ratio
This specifies the horizontal margin between the chart and the border of the sparkline box. This ratio is relative to the width of the sparkline box. Half of this margin appears on either side of the chart.
Margin Y Ratio
This specifies the vertical margin between the chart and the border of the sparkline box. This ratio is relative to the height of the sparkline box. Half of this margin appears on both the top and bottom of the chart.
Maximum Points
This option is not currently used.
Axis Settings
These options determine the X Minimum, X Maximum, Y Minimum, and Y Maximum limits that are specified for values shown in the chart. Check the Auto box next to the appropriate limit to allow these to be auto determined based on the values being shown, or enter values to User Specify these.
The Treatment of User Specified Min/Max options are not currently used.
Example
The following is an example showing sparklines for bus frequency from transient stability results.
