QV Curves Results: Listing
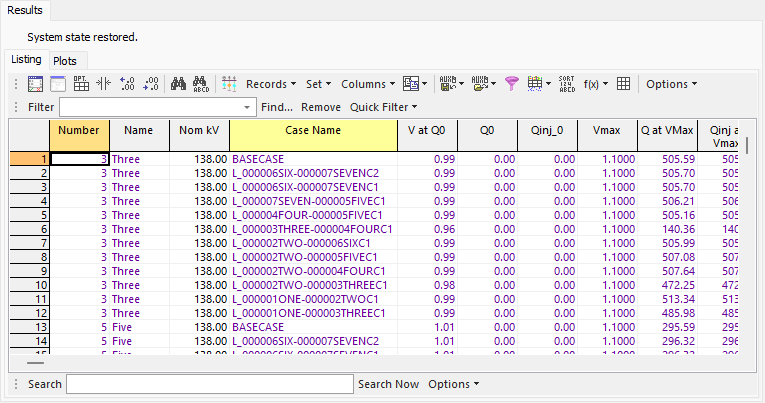
The Listing sub-tab is found on the Results page of the QV Curves dialog. This page provides a summary of all scenarios studied and their results. This table will update as the analysis progresses.
The listing is a case information display and therefore can be used in a manner consistent with all other case information displays.
There are a number of fields that are shown by default on the display:
Number, Name, Nom kV
Number, name, and nominal kV voltage of the studied bus, respectively. This along with the Case Name identifies the scenario. A scenario is uniquely identified by key fields using the Number and Case Name.
Case Name
Either BASECASE or the name of a contingency.
V at Q0
Per-unit voltage in the starting case (base case operating point). The starting case is either the base case or a contingency case. This is the voltage that is recorded prior to starting any QV curve tracing. This is the voltage at Q0.
If the case is not solvable and a successful attempt is made at finding the solvable point by using the fake generator to provide Mvar injection, this is the voltage recorded once the case becomes solvable.
Q0
Mvar output of the fake generator in the starting case (base case operating point). The starting case is either the base case or contingency case. This is the Mvar output that is recorded prior to starting any QV curve tracing.
If the case is not solvable and a successful attempt is made at finding the solvable point by using the fake generator to provide Mvar injection, this is the Mvar output of the fake generator that is required to make the case solvable. Therefore, a non-zero entry means that the initial starting case was not solvable.
Qinj_0
Total Mvar injection in the starting case (base case operating point). The starting case is either the base case or contingency case. This is the total injection that is recorded prior to starting any QV curve tracing. This includes the shunt injection from bus shunts and switched shunts and the output of the fake generator.
Vmax
Maximum per-unit voltage that was recorded.
Q at VMax
Mvar injection of the fake generator at the maximum per-unit voltage that was recorded, Vmax.
Qinj at Vmax
Total Mvar injection at the maximum per-unit voltage that was recorded, Vmax. This includes the shunt injection from bus shunts and switched shunts and the output of the fake generator.
V at Qmin
Per-unit voltage at the minimum recorded fake generator injection, Qmin.
Qmin
Minimum recorded fake generator injection. If negative, this is the amount that the Mvar load can be increased before voltage collapse. If positive, this is the amount of Mvar injection required to come out of collapse and achieve a solvable case.
Qinj_min
Total minimum recorded Mvar injection. This includes the shunt injection from bus shunts and switched shunts and the output of the fake generator.
Vmin
Minimum per-unit voltage that was recorded.
Q at Vmin
Mvar injection of the fake generator at the minimum per-unit voltage that was recorded, Vmin.
Qinj at Vmin
Total Mvar injection at the minimum per-unit voltage that was recorded, Vmin. This includes the shunt injection from bus shunts and switched shunt and the output of the fake generator.
These fields will all contain DIVERGED if the contingency cannot be solved. They will contain ABORTED if the contingency cannot be solved because an Abort contingency action was implemented.
The right-click local menu has one option specific to QV results:
Plot QV Curve
This will plot the QV curve for the selected scenario. What value of Q to plot is determined by the options selected for how to treat Q as found on the Output sub-tab of the Options page. If multiple scenarios are selected, the curves for the multiple scenarios will be shown on the same plot.
A special field has been added to the Listing table that is intended to make it a bit easier for ordering and selecting multiple scenarios for plotting. This field is called User Defined Integer and allows the user to simply order the scenarios to be plotted on the same plot. Doing a simple sort on this field will then arrange all of the scenarios so that they can easily be selected for plotting.