Transient Stability: Running Multiple Contingencies
Most of the help documentation discusses how Transient Stability Dialog functions when you are simulating only a single transient contingency event. When changing the Process Contingencies option to Multiple Contingencies instead, the dialog will change in small ways throughout. This topic discusses how the dialog behaves differently when running multiple contingencies.
The ultimate goal of the transient stability tool is to run multiple potential transient contingencies to determine if any violations of any standards has occurred. When running multiple contingencies, our design goal was to make a transient stability run very similar to running a contingency analysis run using repeated power flow solutions. The transient stability interface has been designed to provide the ability to simulate and interact with multiple stability runs simultaneously. Obviously the speed of such a simulation will be much slower than for contingency analysis, but the goal for the tool should be to emulate the contingency analysis environment. These sections discuss three topics related to achieving this goal: user interface implications, data storage, and the use of transient limit monitors.
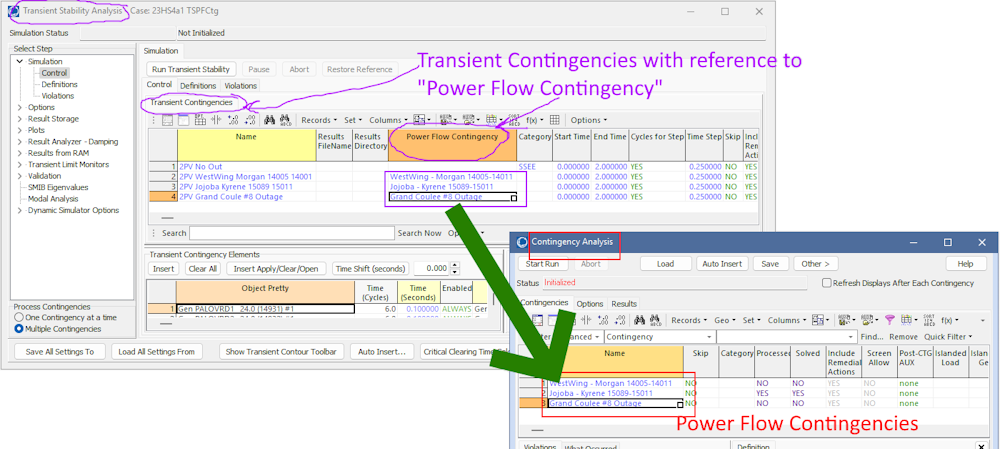
Using a Power Flow Contingency to modify the Initial Condition for Multiple Contingencies ( Added in version 24 )
Each TSContingency may assign a field for PowerFlowContingency which specifies a Power Flow Contingency that represents the initial condition for the Transient Contingency simulation.

General User Interface Changes
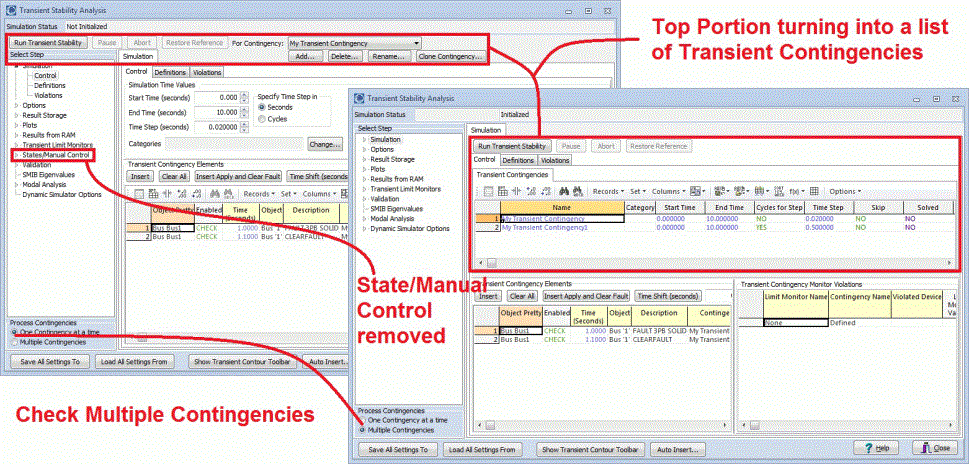
When choosing to process multiple contingencies, the Simulation portion of the Transient Stability dialog into a form which looks very similar to PowerWorld's existing contingency analysis tool. At the top will be a list of the transient contingency definitions with columns for the Start Time, End Time, Cycles for Step, and Time Step. When you select a particular transient contingency from this list, the list at the bottom of the dialog will show the particular elements which are part of the selected transient contingency. This is shown in the figure below.

There are 3 fields to indicate if the contigency is Solved, Processed and the Reason Not Solved:
1. Processed: This will say YES if the transient contingency solution was attempted
2. Solved: This will say YES only if the transient contingency solution was run and successfully finished
3. Reason Not Solved: When Solved = NO, this will be a string indicating why the solution was not finished
Also note that the States/Manual Control portion of the dialog is removed. The assumption is that you will not want to manually step through a stability run a few time steps at a time if you're running multiple transient contingencies. The Plots and Results (for viewing tabular result) are changed when interpreting multiple contingency analysis runs. These will be discussed shortly.
Other portions of the dialog have very few changes. The Options do not change at all and will apply to all transient contingencies. The Results Storage will also apply to all transient contingencies. Validation and SMIB Eigenvalues only apply to the initial steady state system so they will also not change. Transient Limit Monitors do not change because they apply to all contingencies and each of the Transient Limit Violations always reference a particular transient contingency.
Plots for Multiple Contingency Results
The Plots portion of the Transient Stability dialog changes slightly when processing multiple contingency results. By default, a dropdown allows you to choose for which transient contingency a plot will be drawn. When creating a plot for only one contingency the behavior is identical as described in Section 6. You may also check the box Plot Multiple Contingencies which will modify the behavior of plotting. When doing this you should then click the button Choose Contingencies to Plot which brings up a list of all the Transient Contingencies defined in the case. This is all depicted in the following figure.

On the list of contingencies there will be five new columns with values that may be specified and whose affect is described as follows. Setting Show to YES will cause plot series for that contingency to be generated. If a plot has 10 subplot series inside of it and you choose to show results for 4 transient contingencies, then the resulting chart will contain each of those 10 plot series for each of the 4 contingencies and thus contain 40 plot series. Changing the Plot Color will allow each plot series for that particular contingency to use this color, overriding what was specified with the plot definition. Similarly the Dashed, Thickness, and Point Symbol may be changed with the resulting attribute applied to all plot series for the particular contingency overriding what is specified with the plot definition.
In this way you can generate a plot showing multiple traces from multiple transient contingency simulations. An example is shown below of a state space plot for two different faults, with a different color used for each contingency.

Two fields for a TSContingency object named ResultFilename and ResultDirectory were added in the May 17, 2023 patch of Simulator 23. By default these are blank and the existing behavior will remain which is that hard-drive results are stored to and read from the directory specified in the Hard Drive Result Storage options and all result files are expected to have the name of the TSContingency with the appropriate extension (TSR, AUX, image file format such as JPEG, and so on). This default behavior can now be overridden by specifying either a ResultFilename or ResultDirectory.
TSContingency ResultFilename field May 17, 2023 patch of Simulator 23
Should not include any file extension, so if a value of MyFile.tsr is specified in this field, then the actual files written out would have names such as "MyFile.tsr.tsr" and "MyFile.tsr.aux". So do not include an extension in ResultFileName.
TCContingency ResultDirectory fieldMay 17, 2023 patch of Simulator 23
May be either an absolute path or a relative path. An empty string means the directory specified in the Save to Hard Drive Options is used. If this is a relative path, then it will be the path relative to the RSHD_Directory path set with the Save to Hard Drive Options. If this is an absolute path it will be used directly.
Tabular Results for Multiple Contingency Analysis Simulations
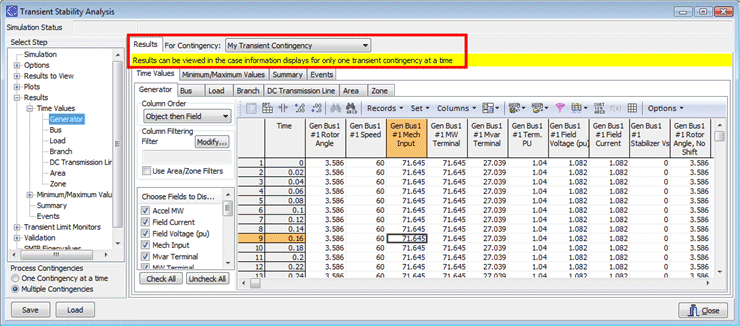
Showing of tabular results was already extremely intricate for looking at only one transient contingency event. At this time the user interface has not been designed to support viewing tabular results for multiple transient contingency simulations simultaneously. As a result when going to the Results portion of the transient stability dialog it will be modified slightly to provide a dropdown that allows you to choose for which transient contingency to view results. This is shown in the figure below. From this point the behavior is identical as described in Transient Stability Results: Time Values.

Note that in Results from RAM tab to Show Multiple Contingencies Events when Multiple Contingencies are being processed, there is an option to Show Results for - Only Active Contingency or All Contingencies that is available for Minimum/Maximum Values, Events, and Solution Details tabs. Only Active Contingency will how the results for the current active contingency, or All Contingencies will show the results for all of the contingencies in transient stability:
