Normally when using a power flow solution tool, you only look at the voltages at the terminal buses of transmission lines. However, for transmission lines which have large shunt charging susceptance (B) terms, the voltages at intermediate points of the transmission line can become much higher (or even lower) than the terminal bus values. To see these voltages directly, Simulator provides a tool for showing the Long Line Voltage Profile of a transmission line (or multi-section line).
|
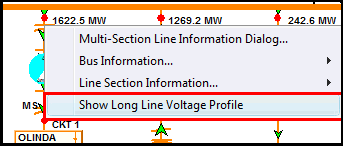
You may show the voltage profile along the length of a transmission line in two ways. First on any oneline diagram (including the Bus View), you may right-click on a transmission line and choose Show Long Line Voltage Profile.
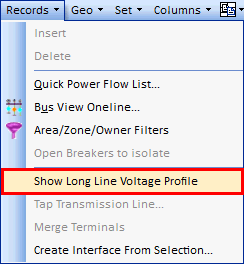
Second on the Records menu of any case information display showing transmission branches, the will be an option to Show Long Line Voltage Profile. If you select multiple transmission lines, then the dialog will show the voltage profile on each transmission line.
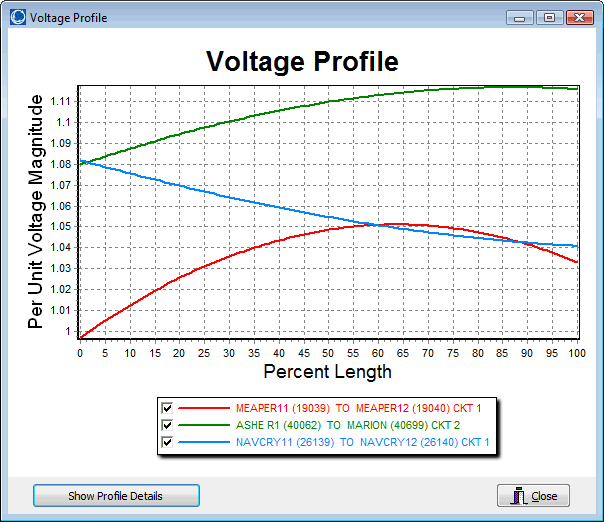
After you have chosen to show the voltage profile, a dialog will appear showing a graph of the voltage profile for each line selected. There will be a legend with check boxes that allow you to hide or show particular curves. The horizontal axis will represent the percent length of the transmission line. The vertical axis will represent the per unit voltage at each particular point along the transmission line. A per unit voltage is calculated at 101 points along the transmission line starting at 0%, 1%, ... up to 100% of the length of the transmission line. The voltage shown at 0% represents the voltage at the FROM bus of the transmission line. The voltage shown at 100% represents the voltage at the TO bus of the transmission line. This is shown in the figure below.
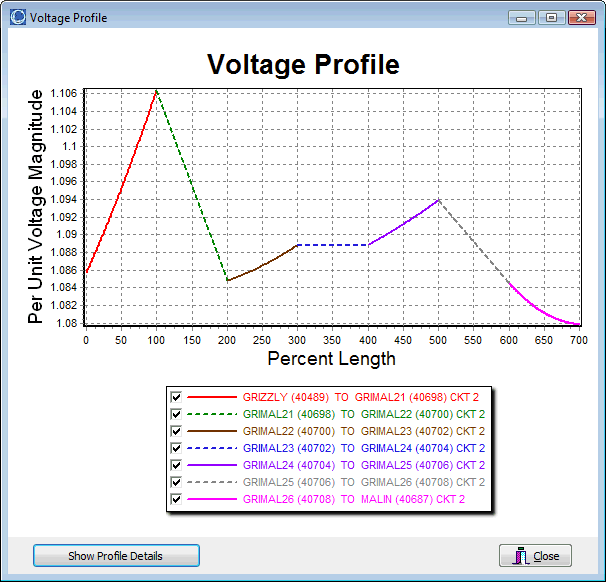
When showing show the voltage profile across a multi-section line, each line section is represented separately on the plot and is shown in one of the "100 ranges" on the x-axis. For instance the third line section will appear between 200% and 300%. Also series caps and transformers are shown as dotted lines on these plots. This is shown in the second figure below. |
|
To get exact details of what the voltage profile can be shown by clicking on the Show Profile Details button. This will display a dialog as shown next.
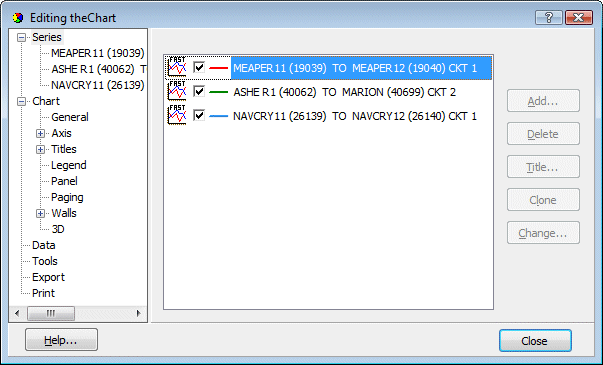
Of particular interest on the dialog that appears is the ability to export this data to Excel or text. This can be done by going to Export and then choosing the Data tab as shown next. Clicking on the Save button will then save the data to a CSV file.
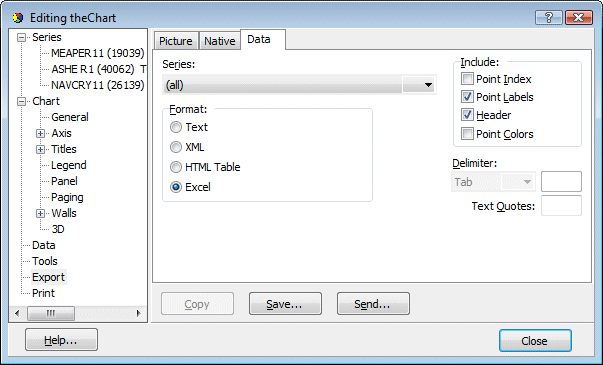
You may also play with this dialog to see all the possibilities for customizing your plots as well as printing them.
